Input-Output Table
The input-output table represents the output and input structure for each product, assuming that a single product is produced for each industry. This presupposes the use of the same production technology. Therefore, input-output tables are used to analyze the ripple effects between sectors.
Coefficients obtained from the input-output table are extensively employed in economic analysis, with the fundamental input coefficient taking a prominent role. This coefficient is determined by dividing the combined value of intermediate inputs and production factors utilized in the creation of each product by the overall input (or output) value. Given that the value of production factors aligns with value-added, the input coefficient further categorizes into intermediate input coefficients and value-added coefficients. This breakdown facilitates a comprehensive exploration of the production technology structure associated with each product.
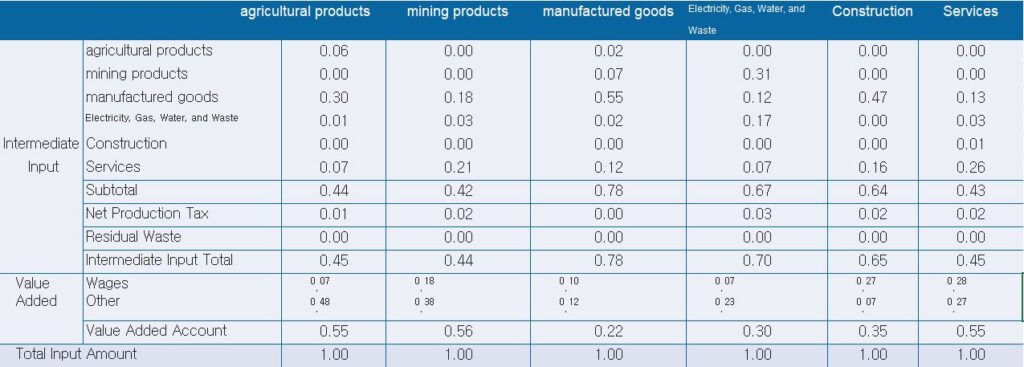
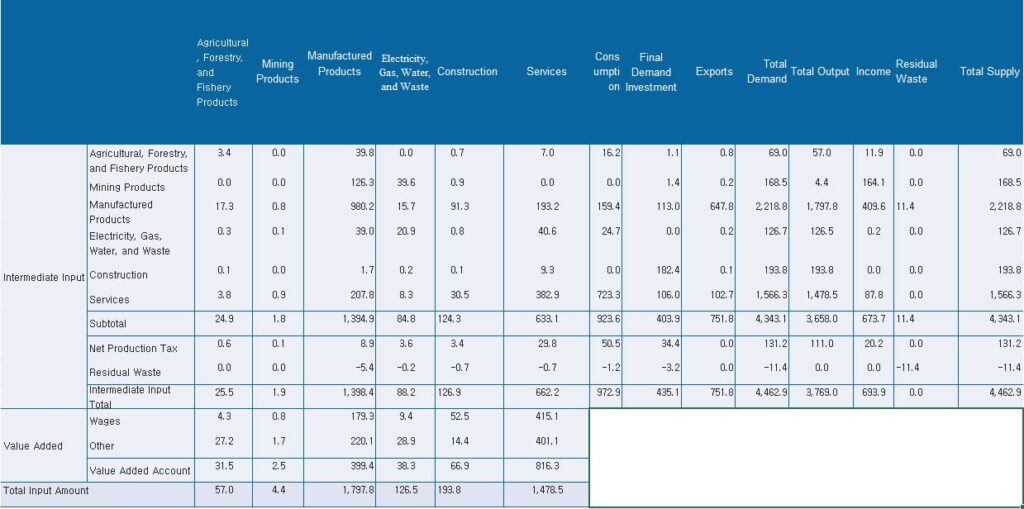
By leveraging input-output tables, it becomes feasible to gauge the cascading effects of price fluctuations in factors like raw materials or wages. As input coefficients portray the input structure of each industry, delineating cost compositions, it opens avenues for analyzing how changes in prices of different input elements (such as wages, public utilities, oil prices, exchange rates, etc.) influence the output prices within each industry. The table below represents the integration of the 2014 input-output table into six sectors.
Input coefficient
The table above illustrates the production of a total of 179.78 trillion won worth of manufactured goods in 2014. It indicates that agricultural, forestry, and fisheries products accounted for 39.8 trillion won, mining products for 126.3 trillion won, manufactured goods (within the same sector) for 980.2 trillion won, and services for 207.8 trillion won as intermediate inputs. Therefore, the intermediate input coefficients for manufactured goods are 0.02 (39.8 trillion won ÷ 1797.8 trillion won), 0.07 (126.3 trillion won ÷ 1797.8 trillion won), 0.55 (980.2 trillion won ÷ 1797.8 trillion won), …, 0.12 (207.8 trillion won ÷ 1797.8 trillion won). This signifies that to produce one unit of manufactured goods, 0.02 units of agricultural, forestry, and fisheries products, 0.07 units of mining products, 0.55 units of manufactured goods, 0.12 units of services, and so on, were utilized as intermediate inputs. When considering net output taxes and waste together, the total intermediate input coefficient is 0.78.
In the given table, value-added refers to the value of production factors input into the production process. For the production of one unit of manufactured goods, a total value-added of 0.22 units was generated, consisting of wages at 0.10 units (179.3 trillion won ÷ 1,797.8 trillion won) and other items such as operating surplus at 0.12 units (220.1 trillion won ÷ 1,797.8 trillion won). Adding the intermediate input coefficient of 0.78 for manufactured goods to the value-added coefficient of 0.22 results in a sum of 1. This pattern holds true vertically, meaning that the input coefficients of a sector always sum to 1. The table below presents the input coefficient table based on the 2014 input-output table provided above.

Production-induced coefficient
In a country, the ultimate purpose of each industry engaging in production activities is to meet final demands such as consumption, investment, and exports. Therefore, understanding the impact of final demand components like consumption, investment, and exports on production, specifically the production-induced effects of final demand, is a crucial analytical focus. The production-induced effects can be measured by production-induced coefficients, which are derived based on input coefficients.
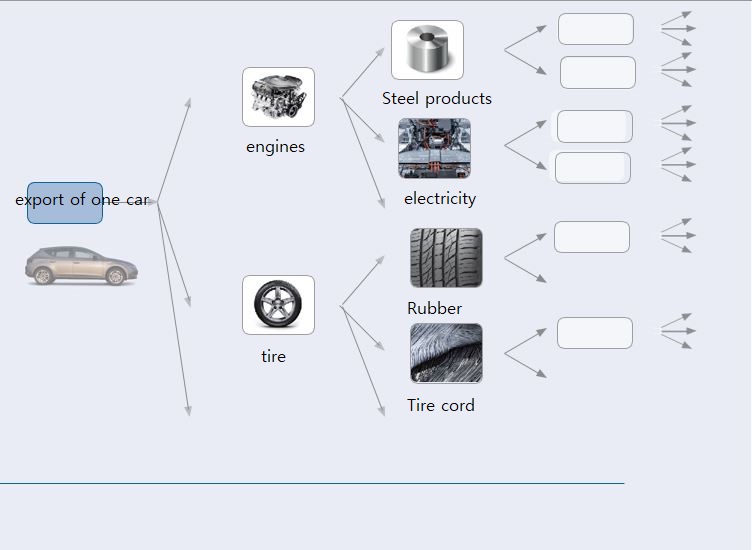
Now, let’s examine the production-induced effects of producing a single car for export, referring to the illustration below. To manufacture one car, as seen in the illustration, numerous intermediate goods such as engines and tires need to be produced. Additionally, the production of these intermediates requires the manufacturing of other raw materials like steel products, rubber, and tire cords.

In this way, the production of cars influences the production activities of many seemingly unrelated industries, and these production-induced effects persist until a balance in supply and demand is achieved between industries.
Let’s explain the ripple effect of production using the numerical values in the table above. To export one unit of manufactured goods, one unit of manufactured goods must be produced. Various raw materials and intermediate goods are required for this production. Let’s examine what products need to be produced to meet these requirements.
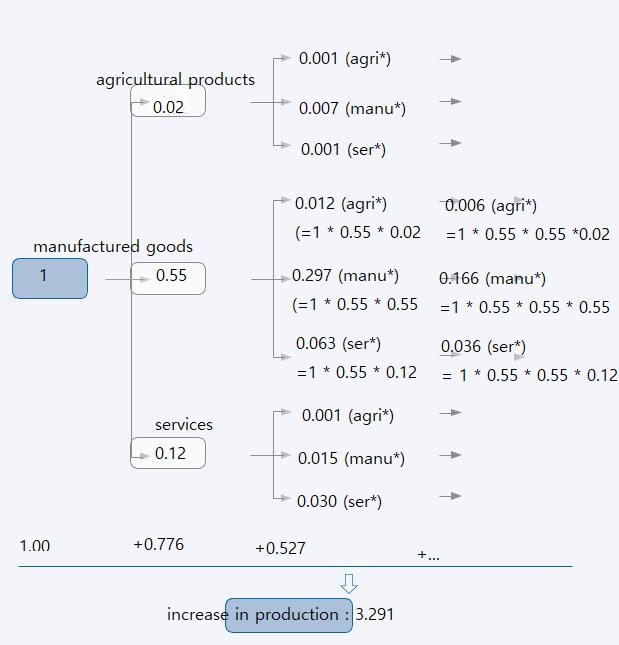
In the table above, the vertical direction for manufactured goods indicates that, for the production of one unit of manufactured goods, intermediate inputs such as agricultural products at 0.02 units, mining products at 0.07 units, manufactured goods at 0.55 units, services at 0.12 units, and so on, need to be produced. Therefore, the primary outputs required for the production of one unit of manufactured goods are all 0.78 units. This represents the first-round production ripple effect of a 1-unit increase in export demand for manufactured goods, affecting all industries equally.
The second-round production ripple effect, represented by the production of agricultural products at 0.02 units, mining products at 0.07 units, manufactured goods at 0.55 units, services at 0.12 units, etc., requires a total input of 0.527 units. The calculation of the 0.527 units for the second-round production ripple effect is as follows:
For the production of 0.02 units of agricultural products: 0.010 units of inputs are needed (0.02 × 0.06 + 0.02 × 0.00 + 0.02 × 0.30 + … + 0.02 × 0.07).
For the production of 0.07 units of mining products: 0.029 units of inputs are needed (0.07 × 0.00 + 0.07 × 0.00 + 0.07 × 0.18 + … + 0.07 × 0.21).
For the production of 0.55 units of manufactured goods: 0.423 units of inputs are needed (0.55 × 0.02 + 0.55 × 0.07 + 0.55 × 0.55 + … + 0.55 × 0.12).
For the production of 0.12 units of services: 0.049 units of inputs are needed (0.12 × 0.00 + 0.12 × 0.00 + 0.12 × 0.13 + … + 0.12 × 0.26).
The sum of these values equals the total input of 0.527 units for the second-round production ripple effect.
The ripple effects of production, as described, continue indefinitely until the effects diminish to zero in subsequent rounds (3rd, 4th, and so on). The sum of all these production ripple effects, including the infinite rounds, results in the total output induced by the initial export demand of one unit for manufactured goods. This total output represents the overall production-induced effect related to the export demand.
As such, the final demand for a particular product not only influences the production of that product but also extends its impact to the production of all products related to it. The process is illustrated in the diagram below.
The production ripple effects examined above are measured by the input-output coefficients. In other words, the input-output coefficients represent the total output induced directly and indirectly in all sectors, including the sector producing the specific product, when the final demand for a product increases by one unit. The input-output coefficients are derived using a mathematical method called the inverse matrix, and for this reason, they are also referred to as Leontief inverse coefficients.

The production-induced coefficient table below is derived using the input coefficient table above.

In this table, the vertical direction for manufactured goods represents the production of each product, both directly and indirectly induced, to fulfill a final demand increase of 1 unit for manufactured goods. In other words, if there is a final demand increase of 1 unit for manufactured goods, it would require the production of 0.06 units of agricultural products, 0.20 units of mining products, 2.48 units of manufactured goods, 0.46 units of services, and so on. Therefore, for the entire economy, a total production of 3.29 units would be needed to satisfy a final demand increase of 1 unit for manufactured goods.
In the horizontal direction for manufactured goods, when the final demand for all products, including agricultural products, mining products, manufactured goods, and services, increases by 1 unit each, the production of manufactured goods is indicated. Specifically, if the final demand for agricultural products, mining products, manufactured goods, and services each increases by 1 unit, the production of manufactured goods would need to be 0.84 units, 0.55 units, 2.48 units, 0.62 units, and so on. This implies that a total production of 6.22 units for manufactured goods is required to meet the increased final demand of 1 unit for each product category.
In addition to the production-induced coefficients, various other coefficients such as income-induced coefficients, value-added-induced coefficients, and employment-induced coefficients are also utilized in various industrial impact analyses.
Influence coefficient & Responsiveness coefficient
Using the production-induced coefficients, one can understand the forward and backward linkages of each industry. The degree of backward linkage is measured by the impact coefficient, while the degree of forward linkage is determined by the sensitivity coefficient. The impact and sensitivity coefficients are calculated relative to the average production-induced coefficient for the entire economy.
In the table above, the impact coefficient for manufactured goods is calculated by dividing the column total of the manufactured goods production-induced coefficients (3.29) by the average production-induced coefficient for all six sectors (2.55), resulting in a value of 1.29. The sensitivity coefficient for manufactured goods is calculated by dividing the row total of the manufactured goods production-induced coefficients (6.22) by the average production-induced coefficient for all six sectors (2.55), resulting in a value of 2.44.
Generally, when the production of one industry relies heavily on the output of another industry as intermediate inputs, resulting in a high input-output ratio, the impact coefficient tends to be high, leading to larger backward linkage effects. Conversely, when the output of one industry is heavily used as intermediate inputs in the production of other industries, leading to a high intermediate demand ratio, the sensitivity coefficient tends to be high, resulting in larger forward linkage effects. Therefore, industries with high input-output ratios and intermediate demand ratios tend to have a higher level of production activity in response to changes in demand within the economy.
Impact and sensitivity coefficients are valuable in determining the efficiency of investing limited resources in various industries.


