01. National Income Statistics

Table of Contents

Supply consumption table

As explained earlier, the supply table represents the output of products by industry, while the use table records the details of products used as intermediate or final demand in an industry, along with the value added by industry. Therefore, the supply and use table, which comprehensively covers both supply and use, is considered more suitable for understanding industrial structure than input-output tables that assume single-product production, as it reflects the production of various products in combination within the industry.

Supply and Demand Structure

According to the supply and use table, the supply and demand structure of our economy in 2014 is as follows. The total value of goods and services supplied in our country during the year was 423.7 trillion won, with 84.1% (356.41 trillion won) being supplied through domestic production, and the remaining 15.9% (67.37 trillion won) being supplied through imports. Out of the supplied goods and services, 51.0% (216.29 trillion won) were used as intermediate demand for domestic production, and 31.2% (132.31 trillion won) were used for domestic final demand, such as consumption and investment. The remaining 17.7% (75.18 trillion won) was exported to foreign countries.

In 2014, the proportion of imports in the total supply was 15.9%, and the proportion of exports in the total demand was 17.7%. Therefore, the share of foreign trade in our economy, calculated as (exports + imports) ÷ total supply (= total demand), was 33.6% during 2014.

Industrial Structure

Industrial Structure is determined by the proportion that individual industries occupy in the overall economy, either in terms of output or value added. While the national income accounts calculate the industrial structure based on value added, the input-output tables are based on output.

The table below represents the industrial structure of our economy according to the input-output table. In 2014, the proportion of output by industry in South Korea was as follows: Manufacturing accounted for the highest share at 48.5%, followed by the services sector at 40.9%. Construction and the electricity, gas, water, and waste disposal industries accounted for 5.5% and 3.5%, respectively. Compared to 2013, there was an increase in the share of the services sector while the share of manufacturing decreased.

Input Structure

When viewing the use table vertically, you can find the details of raw materials and value-added inputs used for the production of goods and services in each industry. The intermediate inputs can be further divided into domestically produced and imported goods, and the proportion of domestically produced goods among these is referred to as the domestic intermediate input ratio.

In 2014, the domestic intermediate input ratio in our economy was 74.9%, which increased by 1.6 percentage points compared to 2013.

On the other hand, the ratio of total value added to total input is referred to as the value added ratio. In 2014, the value added ratio in our economy was 38.5%.

Demand Structure

When you view the use table horizontally, you can determine the usage details for each product. In other words, it distinguishes between intermediate demand, which is used as intermediate inputs in industries, and final demand, which is sold as final products. By dividing these into total demand amounts, you can calculate the intermediate demand ratio and the final demand ratio.

In 2014, the intermediate demand ratio in our economy was 51.3%, which was 0.2 percentage points lower compared to 2013.

Intermediate Demand Ratio

Intermediate Demand Ratio (%) = Intermediate Demand Amount / Total Demand Amount × 100

In 2014, the proportion of consumption in total final demand was 44.5%, while the shares of investment and exports were 19.3% and 36.2%, respectively.

Import Structure

Import Structure refers to the degree of dependence on imported intermediate goods for domestic production activities, the composition of imported products, and the proportion of imports in the total supply, as observed in the previous supply structure.

In 2014, South Korea’s import dependence was 15.5%, which decreased by 1.1 percentage points compared to 2013. Across various industries, it was observed that the import dependence of all industries decreased, with a focus on a 1.6 percentage points decrease in the manufacturing sector.

Import Dependence

Import Dependence (%) = Imported Intermediate Input Amount / Total Input Amount × 100

Meanwhile, when examining the composition of imported goods in South Korea in 2014 by purpose, intermediate goods accounted for 80.7%, while the shares of capital goods and consumer goods were 8.9% and 10.4%, respectively.

supply consumption table
피크코리아 현실적 대응 방안
2024 경제 위기 '피크코리아' 시대에서 가계의 현실적 대처 방안
대한민국의 경제 위기로 대변되는 '피크코리아' 시대에 맞서 가계 주체로서의 개인이 할 수 있는 현실적인 대처 방안에 대해 이야기해보고자 합니다.
KakaoTalk_20231221_115522719
달러 투자, 누구나 할 수 있는 방법 4가지
너무나도 간단한 달러 투자 방법, 대표적인 안전자산 달러에 투자하여 자산을 늘려봅시다.
예금 적금
예금 적금 뭘 선택해야하나요? 예금과 적금 무슨 차이죠?
(금융 상식) 예금과 적금 중 나에게 더 맞는 것은 무엇일까요?
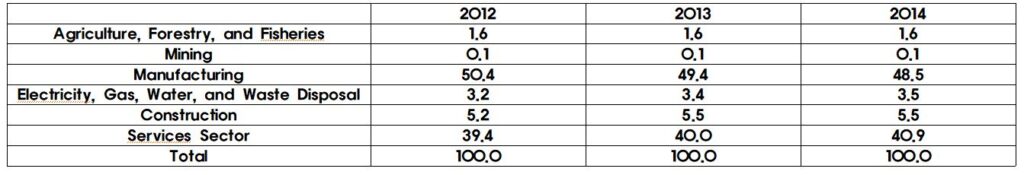
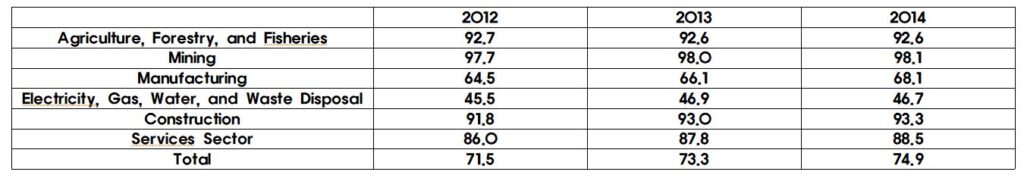
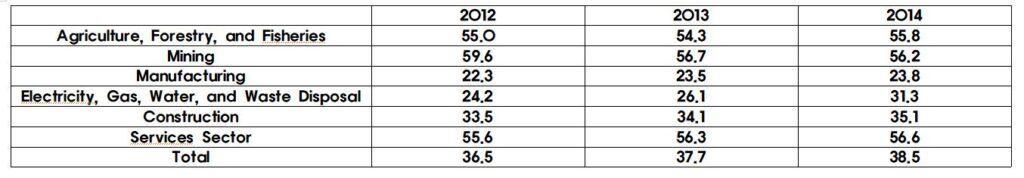
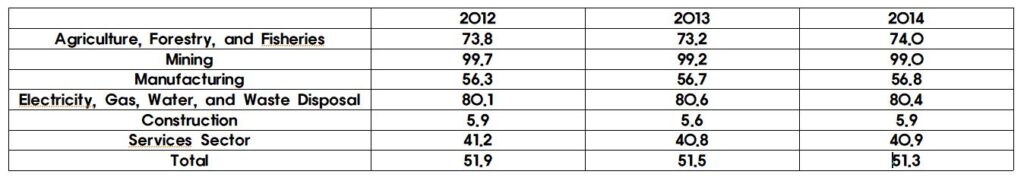
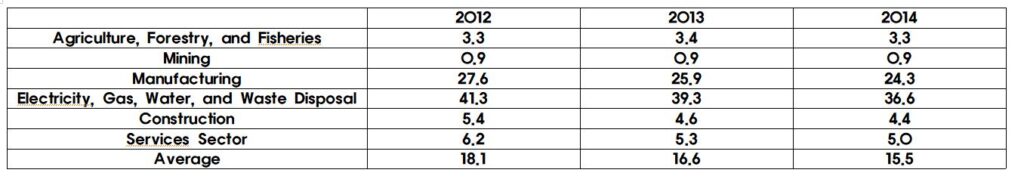
economics lecture
01. National Income Statistics
Input-Output Table The input-output table represents the output and input structure for each product,...
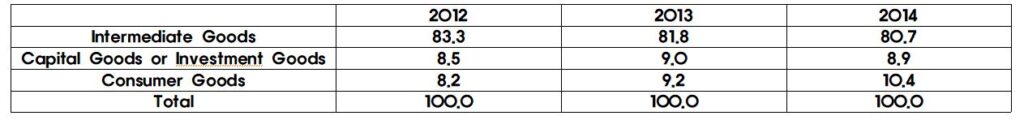
lecture room
01. National Income Statistics
Input-Output Table

댓글 달기

이메일 주소는 공개되지 않습니다. 필수 필드는 *로 표시됩니다